Table of Contents
Ground Station Application
The ground station application has been designed to be a simple and user friendly means of tracking the location of the balloon system both in flight and post-landing.
System Setup
To run the Ground Application you must install a few tools to allow it to function correctly. Failure to intall these tools may result in limited functionality or failure of the application. Steps for configuring each required program are outlined below and should be completed in the order displayed.
Visual Studio
The Ground Application was designed using Microsoft Visual Studio 2010 Express. A free version of this software can be found online (http://www.microsoft.com/visualstudio/eng/downloads#d-2010-express). Expand the “Visual C# 2010 Express” tab, click “Install now” and follow the directions of the installer.
Microsoft Charting library install
The Ground Application uses a Visual Studio charting library to display selected data types in a live graph. The download can be found at: http://www.microsoft.com/en-us/download/details.aspx?id=14422. Simply download MSChart.exe and follow the instructions of the installer
System Config
Once the required systems are downloaded some changes are required so the system will work properly. There are also some optional changes that can be made to customize the software.
APRS Callsign
REQUIRED Transmissions are filtered through a single callsign. Change the value of the labeled text box to modify this value.
COM port config
REQUIRED The application reads radio transmissions through the serial port. To properly receive this data the active COM port must be selected. A text field denotes the COM port that will be opened for communication and is located on map panel of the sidebar in the coordinates section. Change the number in this text box to the correct port to receive data. The Device Manager can be helpful in determining the correct COM port to select.
Caching Offline Maps
RECOMMENDED The Ground Application typically loads map images through an internet connection but such a connection may not be possible while following the balloon system in flight. To mitigate this problem, the Ground Application can be set to prefetch map data prior to the launch. To do this, select an area on the map using ALT+drag left click and then select the “Prefetch Selected Area” button on the “Cache” tab of the sidebar.
Because of the multiple zoom levels on the map, prefetching can be a time consuming process as each zoom level is loaded at a time. This process can be aborted at any time but still preserve the map tiles that have already been loaded. To save time it is suggested to determine an estimated travel route of the balloon system and do a complete fetch of the start and end locations and a partial fetch of the entire route because the higher levels of zoom are only needed at the endpoints.
Changing Graph Data
OPTIONAL The “Graphs” tab displays four charts of different data types in a graph that is updated live as data is received from the balloon system. If desired, the data in these graphs can be changed to one that is more preferred for a particular launch. This can be changed by modifying the code in a few places. Although there are several steps in this process, it is not too difficult for someone with some programming experience.
The first changes should be made in the function PrepareGraphs() within the file MainForm.cs. Change the chart Series and ChartArea to the desired type near the top of the function. Next, scroll down to the prep area section for that chart and replace all of the references to the old data with the new one. The initial value may also be changed to an estimate so the graph will not stretch but this is not required.
Next go to the region “chart click events” and replace all references as was done in the PrepareGraphs() function. Finally, go into the ChartDelegate() function, remove the line that inserts data into the replaced chart and add an equivalent line to the data type that is to be displayed. A search (CTRL+F) is useful to make sure all references have been changed.
Future versions of the software may include a drop down selection for each graph on the tab to simplify this process.
Changing Graph Tab Data Displays
OPTIONAL To change the data that is displayed in the fields above the graphs simply find the click event for a graph in MainForm.cs (~line 1000). Change the assignment value for any textbox (tbox.Text) to the desired value. Mathematical calculations can be done here is desired.
//highlight Bottom Left chart on click and set text box values based on this chart
private void chrtBottomLeft_Click(object sender, EventArgs e)
{
   ResetChartColors();
   chrtBottomLeft.BackColor = Color.Gray;
   tboxChartData.Text = "Pressure";
   tboxCurrent.Text = tboxAtmoPressure.Text;
   tboxAverage.Text = (pressureSum / chrtBottomRight.Series.FindByName("pressureTrend").Points.Count).ToString();
   tboxMax.Text = chrtBottomRight.Series.FindByName("pressureTrend").Points.FindMaxByValue().ToString();
   tboxMin.Text = chrtBottomRight.Series.FindByName("pressureTrend").Points.FindMinByValue().ToString();
}
Usage and Features
Map Tab
This is where the balloon system is tracked in real time from APRS transmissions. It also contains a sidebar with additional options and features.
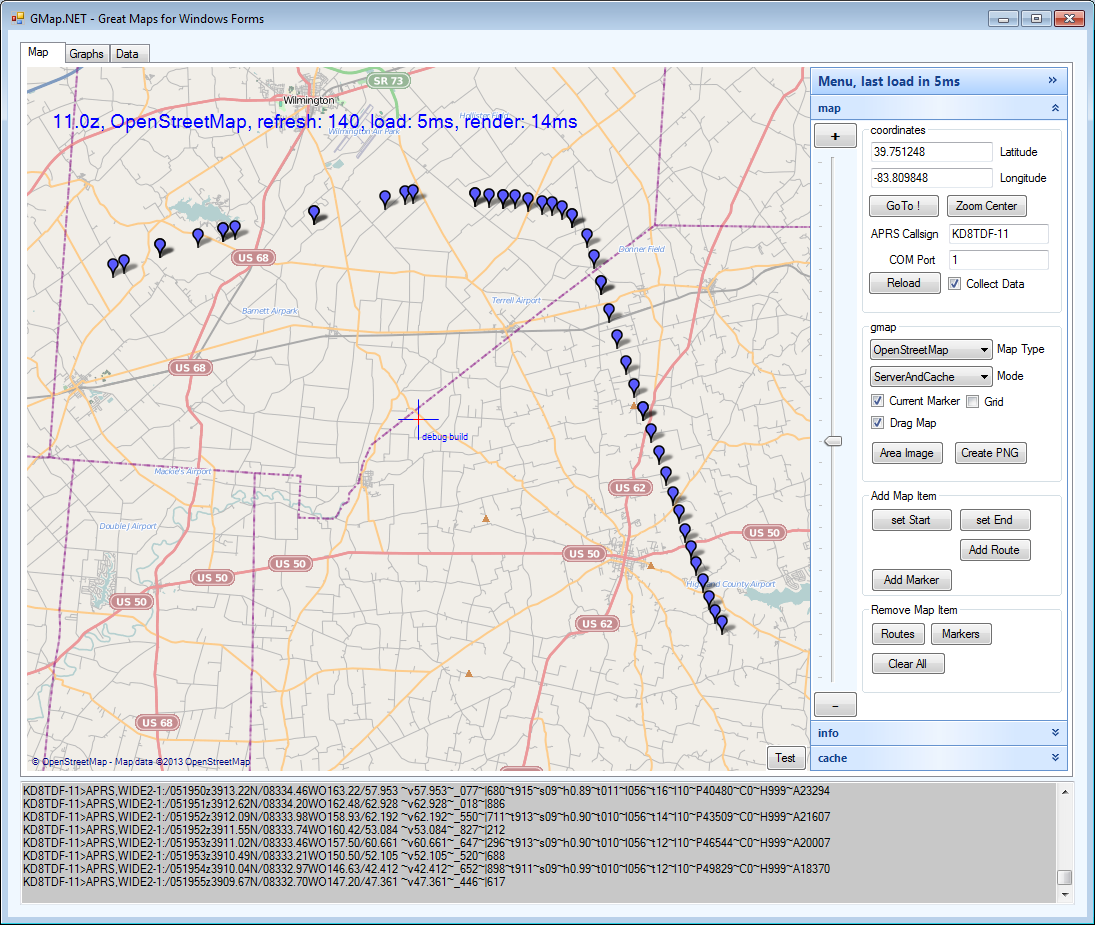
Sidebar
The sidebar contains three panels. The first panel is the map panel which contains several sections.
- +/-/Scroll - Adjusts the zoom on the map
Coordinates
- Go To! - Centers map on coordinates displayed in Latitude and Longitude fields
- Zoom Center - Centers map on all Markers currently displayed
- Reload - Reloads the map
- Collect Data - Allows handling of data from transmissions.
- APRS Callsign - COMING SOON - allows for easy changing of APRS callsign
- COM Port - COMING SOON - allows easy changing of the COM port
GMap
- Map Type - Select the desired map type from the dropdown
- Current Marker - Displays the green Current Marker
- Grid - Displays the map grid
- Drag Map - Allows the map to be dragged by holding the right mouse button
- Area Image - Saves an image of the map region selected using ALT+left click drag
- Create PNG - Saves an image of the current map view
Add Map Item
- Set Start - Sets a start point for a route
- Set End - Sets an end point for a route
- Add Route - Creates a route between Start marker and End Marker
- Add Marker - Places a Marker at the position of the Current marker
- Routes - Clears all Routes from the map - can NOT be undone
- Markers - Clears all Markers from the map - can NOT be undone
- Clear All - Clears all Markers and Routes from the map - can NOT be undone
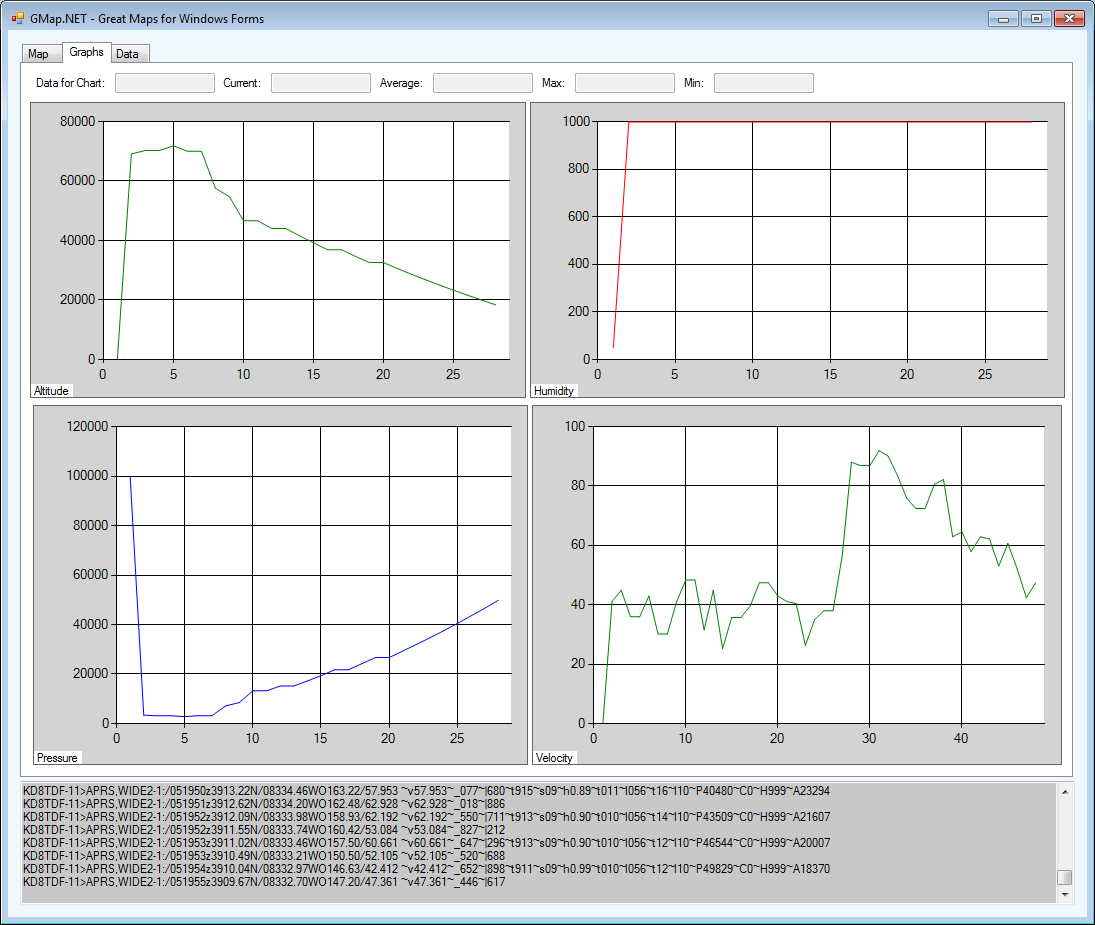
Graphs Tab
Contains four charts to display a custom set of data types for live display. The charts are resizable via a click and drag interface. When a chart is clicked some of the chart data will be displayed at the top of the tab. The most recently received value, average, maximum and minimum values are displayed for that chart.
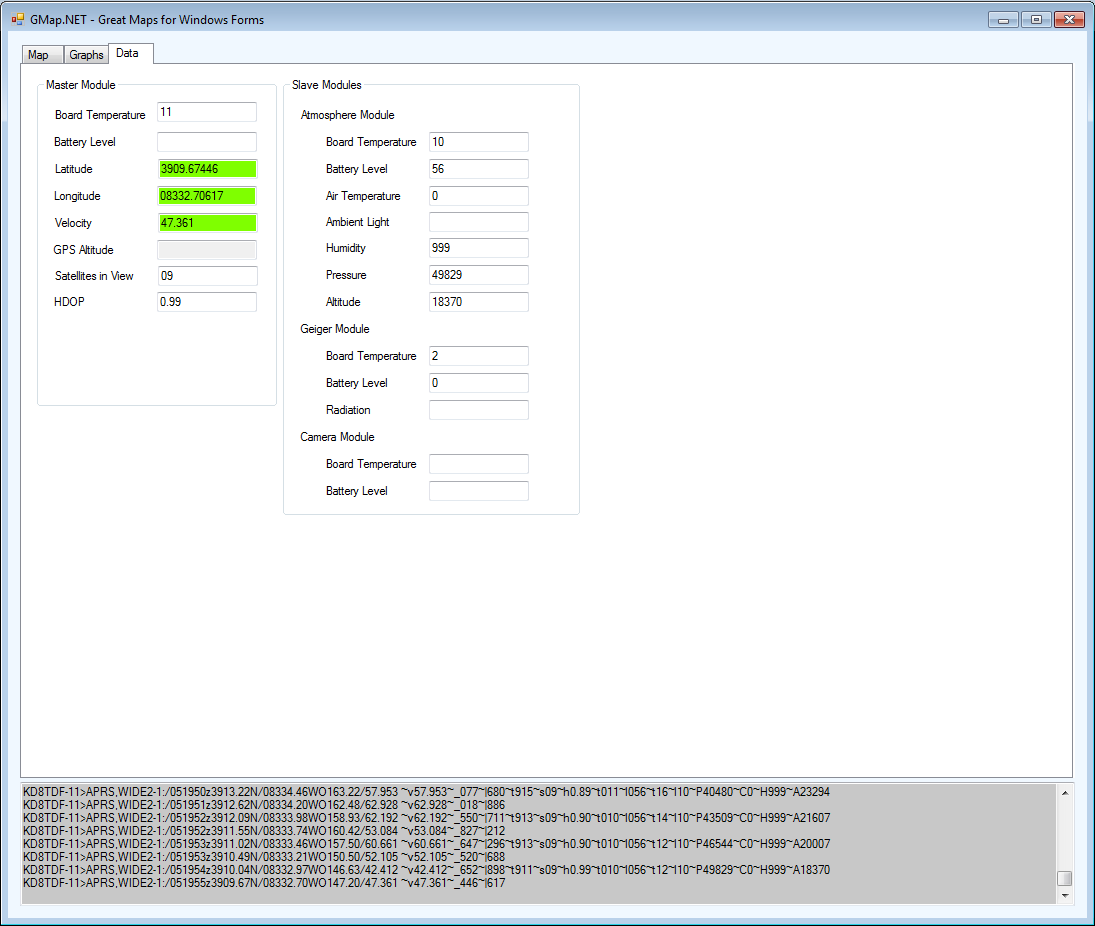
Data Tab
This tab is a display of all possible data types that the balloon can transmit. The data is grouped by module type (master or slave) and further grouped by the type of module. The data display also turns green if that data type was received in the most recent transmission from the balloon system.
Message Box
This text field at the bottom of the application is used to display transmissions as they are received as well as informational and error messages from the balloon system. It is also easy to utilize this textbox for debugging purposes if changes are being made to the ground station functionality.
Test Button
This button is located at the bottom right of the map display was used during initial testing and debugging. The test button currently simulates APRS transmissions and their handling but can be customized in order to assist the testing of other functionality.
Troubleshooting
Probable causes for application failure/error are: incorrect COM port If the program does not launch correctly then check that the receiver radio is properly connected to the computer. If this does not fix the problem there might be a misallocation COM port. Directions for fixing this problem can be found here: Ground Station Application.
If transmissions are not being received then verify the “Collect Data” box has been checked. If problem persists then the APRS callsign may be incorrect. Directions for changing APRS callsign are here: Ground Station Application.